Dynamic population Analysis of the 2024 Noto Peninsula Earthquake
Introduction
The Noto Peninsula Earthquake that occurred on January 1, 2024, was a major earthquake of magnitude 7 on the Japanese scale, followed by a tsunami that caused the collapse of buildings and devastating damage to transportation infrastructure. The disaster forced many residents to evacuate their homes and had a tremendous impact on the entire local community.
This article will introduce examples of real-time dynamic population data visualization and analysis tool “Kompreno®” used to analyze the number of people gathering at designated evacuation centers, undesignated evacuation centers, traffic data, isolated areas, etc. in the Noto Peninsula.
- Use in initial response at the time of a disaster
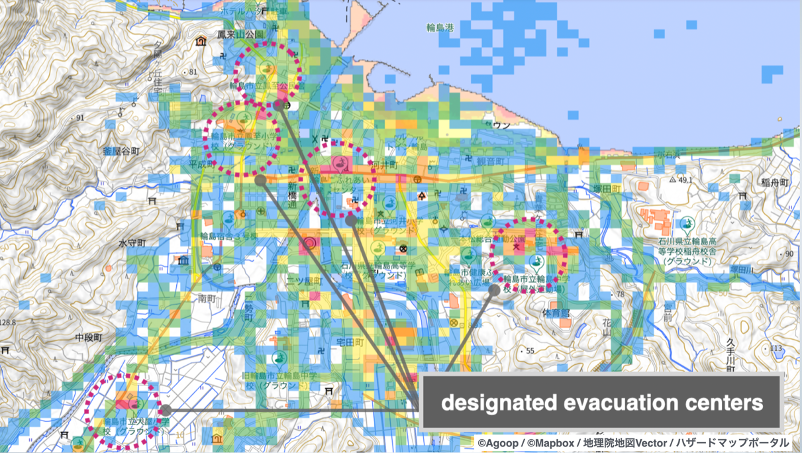
Figure 1: Analysis of evacuation areas in Wajima City
Detection analysis of undesignated evacuation centers was conducted. As an example of detection in Wajima City, we can see people gathering at the Sosogi Tourist Center and a nearby pension (Figure 2). We identified more than 40 such undesignated evacuation centers.
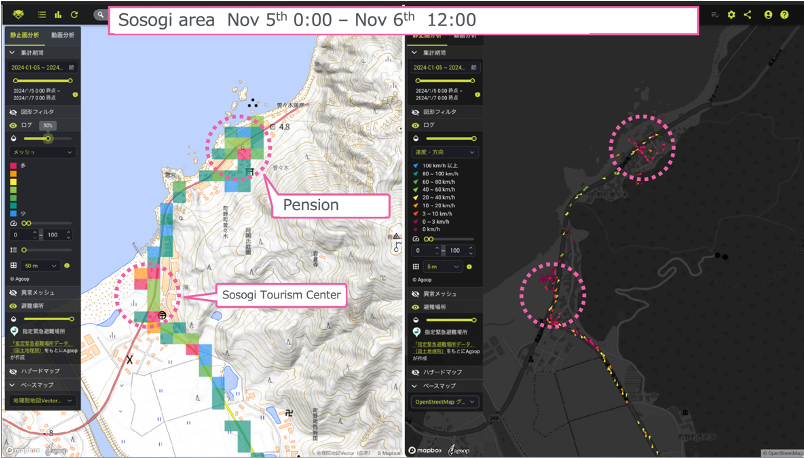
Figure 2:Undesignated Evacuation Areas in Wajima City
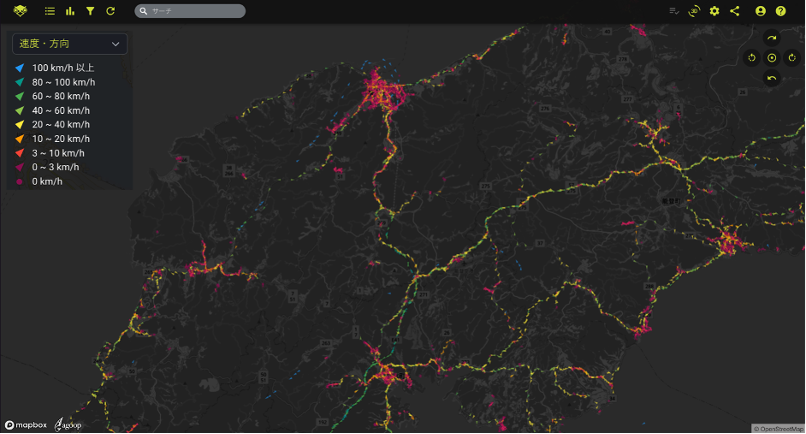
Figure 3::Analysis of traffic performance around Wajima City
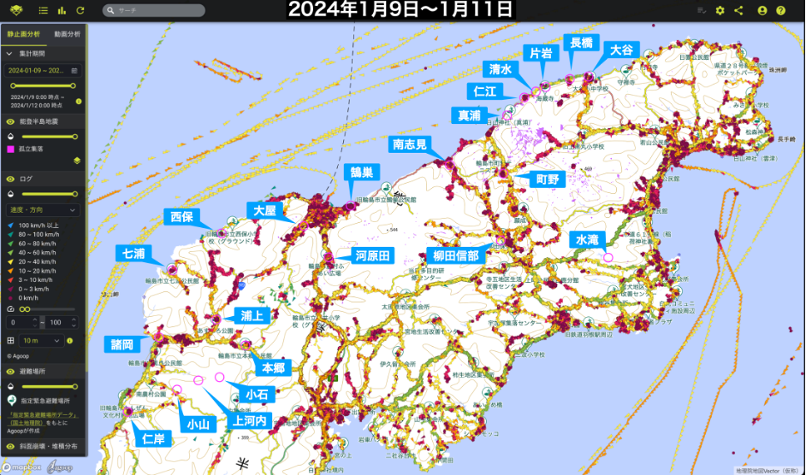
Figure 4: Analysis of isolated villages throughout the Noto Peninsula
The degree to which visitors (non-residents) were staying in the affected area on the day of the disaster was analyzed using “Papilio” (Figure 5). The results of this analysis were also used to examine the capacity of evacuation centers and relief supplies.
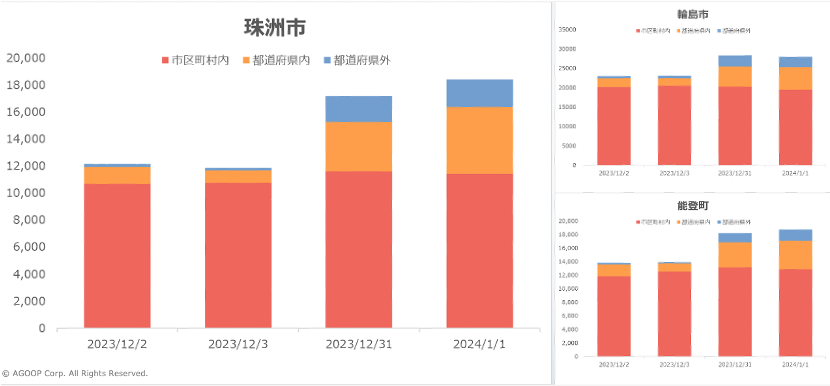
Figure 5:Analysis of residents and visitors within each city
- Use for Post-Analysis
- Future Development
Based on the results of the Noto Peninsula Earthquake, we will accelerate the introduction of the real-time human flow visualization and analysis tool to medical institutions and local governments, and deploy it as a technology that can be used not only for emergency preparedness but also for disaster prevention planning during normal times. Kompreno®” can also be used to analyze evacuation behavior during evacuation drills, and Nemuro City in Hokkaido and Kamaishi City in Iwate Prefecture have conducted large-scale evacuation drills using this tool. By combining the tool with evacuation drills, disaster prevention plans, disaster prevention education, and other peacetime applications, we will create an environment that can be analyzed promptly in the event of an emergency and accelerate the promotion of Disaster Prevention DX.

Secondary use of this page
When using graphs and other data from this page for secondary use, please clearly indicate the source. (e.g.) Data provided by AGOOP Inc.
If you use the map images in this document as is, please include the map credit “© 2023 Mapbox © OpenStreetMap”.